08 Mar 2018
Reading time ~2 minutes
Bundle multiple RSI indicatores in one tradingview panel
Introduction
The web portal Tradingview is a very sophisticated tool, to display for example trends in stock or cryptocurrency prices and and to analyze the future performance with the help of a wide variety of indicators. However, the amount of displayable indicators is tied to the license type and is also limited by the space on the screen. For both reasons, it seemed reasonable to me to combine the important oscillators “RSI” and “stochastic RSI” into one indicator panel. One possibility is using scripting.
Do you know Pine?
For this TradingView provides its own scripting language Pine Script and a built-in script editor. This scripting allows the user to customize the display of the technical indicators and other functions. For more information, see PINE SCRIPT LANGUAGE REFERENCE MANUAL or Pine Script Tutorial .
The indicators
The calculation and presentation of the indicators RSI and stochastic RSI are similar, which makes them good candidates for grouping on a panel.
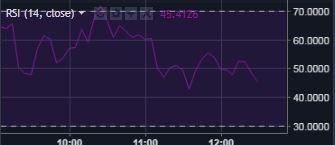
The Relative Strength Index (RSI) is an indicator that reacts to changes in market prices with upward and downward movements and makes it easier to estimate the strength of the current market. For example, a value of 70 or more is considered to be overbought and signals a potential price decline, while a value of 30 or less is over-sold, indicating a potential price increase. Further details can be found here: The Relative Strength Index (RSI).
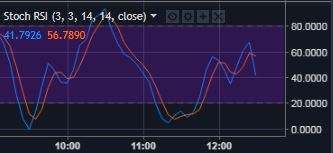
Stochastic RSI's threshold values for the above-mentioned signals are more than 80 or less than 20, more information can be found here: Stochastic oscillators.
The scripting solution
The following pine script calculates both indicators and combines them into one view:
//@version=3
study(title="(Stochastic) RSI", shorttitle="(Stoch)RSI")

// RSI
src = input(close, title="RSI Source")
len = input(14, minval=1, title="RSI Length")
up = rma(max(change(src), 0), len)
down = rma(-min(change(src), 0), len)
rsi = down == 0 ? 100 : up == 0 ? 0 : 100 - (100 / (1 + up / down))

// Stoch
rsi1 = rsi(src, len)
length = input(14, minval=1, title="Stoch Length")
smoothK = input(3, minval=1, title="K")
smoothD = input(3, minval=1, title="D")
k = sma(stoch(rsi1, rsi1, rsi1, length), smoothK)
d = sma(k, smoothD)

// Background Stoch
h0 = hline(80)
h1 = hline(20)
fill(h0, h1, color=#663399, transp=99)

// Background RSI
h2 = hline(70)
h3 = hline(30)
fill(h2, h3, color=#6A5ACD, transp=95)

// Plot Stoch
plot(k, color=#4169E1, title="K")
plot(d, color=orange, title="D")

// Plot RSI
plot(rsi, color=fuchsia, title="RSI")
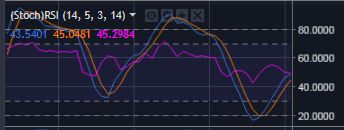
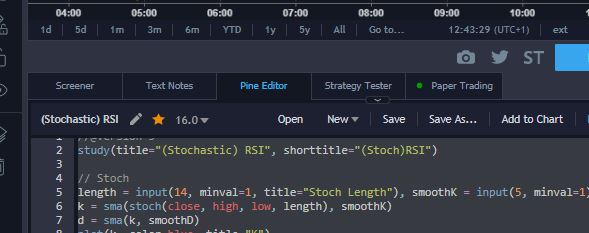
It can be copied directly into the pine editor in the tradingview chart page and added to the current chart view with Add to Chart:
The result is a new panel that looks like this: